App Usage Statistics: Stats
The Stats page lets you review usage for a specific time range — great for weekly retrospectives, periodic summaries, or comparing how much time you've invested in different types of work.
1) Select a Time Range
On the Stats page, you can typically choose a time range such as:
- Last 7 days / Last 30 days
- Custom date range
After selecting a range, the page calculates summaries based on your current tag and category configuration.
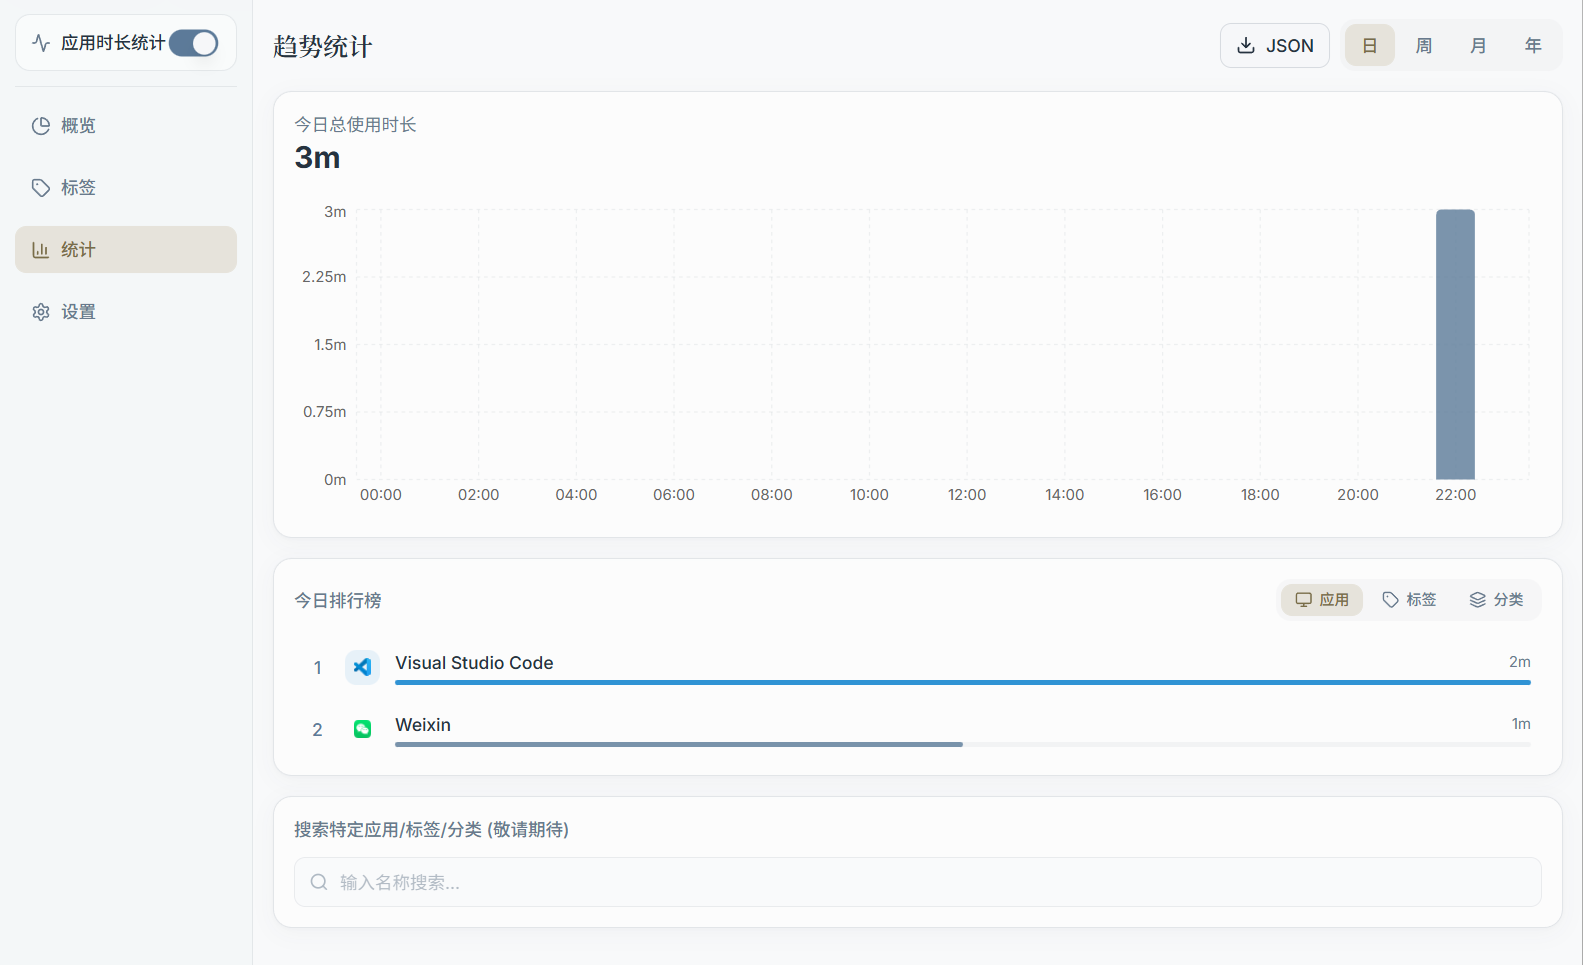
2) Common Content
The Stats page commonly includes:
- Total usage time (for the selected range)
- Top apps ranking (Top Apps)
- Summary by tag/category (helps identify where most of your time goes)
- Trend chart (daily or bucketed changes, depending on the version)
3) Web vs. Desktop Differences
- The desktop app can read locally collected data directly, and can also sync it to the server
- The Web version typically relies on server-side data (requires the desktop app to have synced at some point)