App Usage Statistics: Overview
"App Usage Statistics" tracks how long you spend in each application on your computer, and provides views broken down by app, tag, and category to help you review where your time goes.
1) Sidebar: Toggle & Sub-pages
The left sidebar includes:
- App usage statistics toggle: Only available on the desktop app (Electron); the Web version shows it but may not support toggling
- Overview: Today's total time invested, core focus categories, today's top apps, and more
- Tags: Usage time summarized by your custom "app tags"
- Stats: More trend/time-range analysis (e.g., summaries for a specified period)
- Settings: Ignored apps, idle detection, clearing data, and more
Note:
- Even if you're viewing in the Web version, you may still see stats data (for example, if it was previously synced from the desktop app to the server).
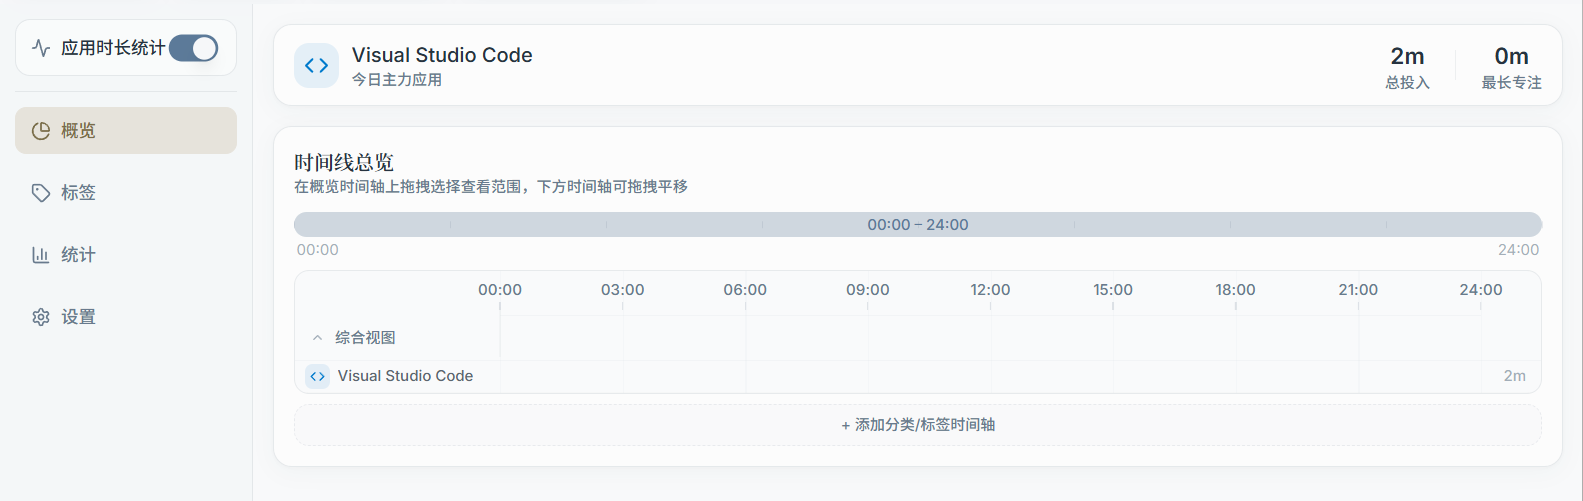
2) Overview Page: What You'll See
The overview page typically includes the following sections (exact cards may change with updates):
- Today's total time: Total usage time for today (based on local date)
- Core focus category: The top category by usage share, based on your app tag/category setup
- Today's top apps by usage time: Top apps listed by minutes/hours
The top-right corner usually lets you switch between:
- App / Tag / Category ranking views
3) Data Source & Notes
- The desktop app collects the usage time of the "currently active foreground app" in the background, saving it in time buckets
- If you turn off the "App usage statistics" toggle, the overview page may show an overlay or stop updating
- For operations like renaming, merging, or moving tags, it's recommended to first read the Tags and Settings pages
Read Next (Select from the left sidebar)
- Tags: App tags and categories, how to group stats
- Stats: Time-range analysis and trend viewing
- Settings: Idle detection, ignore list, clearing stats data