Gantt Chart
The Gantt chart lets you view your tasks as horizontal bars across a time axis, showing their duration and density at a glance. It's ideal for high-level planning and tracking overall progress.
When to Use It
- To see how multiple tasks overlap in time and where gaps exist
- To view the full span of a task from start to due date
- To quickly check whether a particular period is overloaded
How to Open It
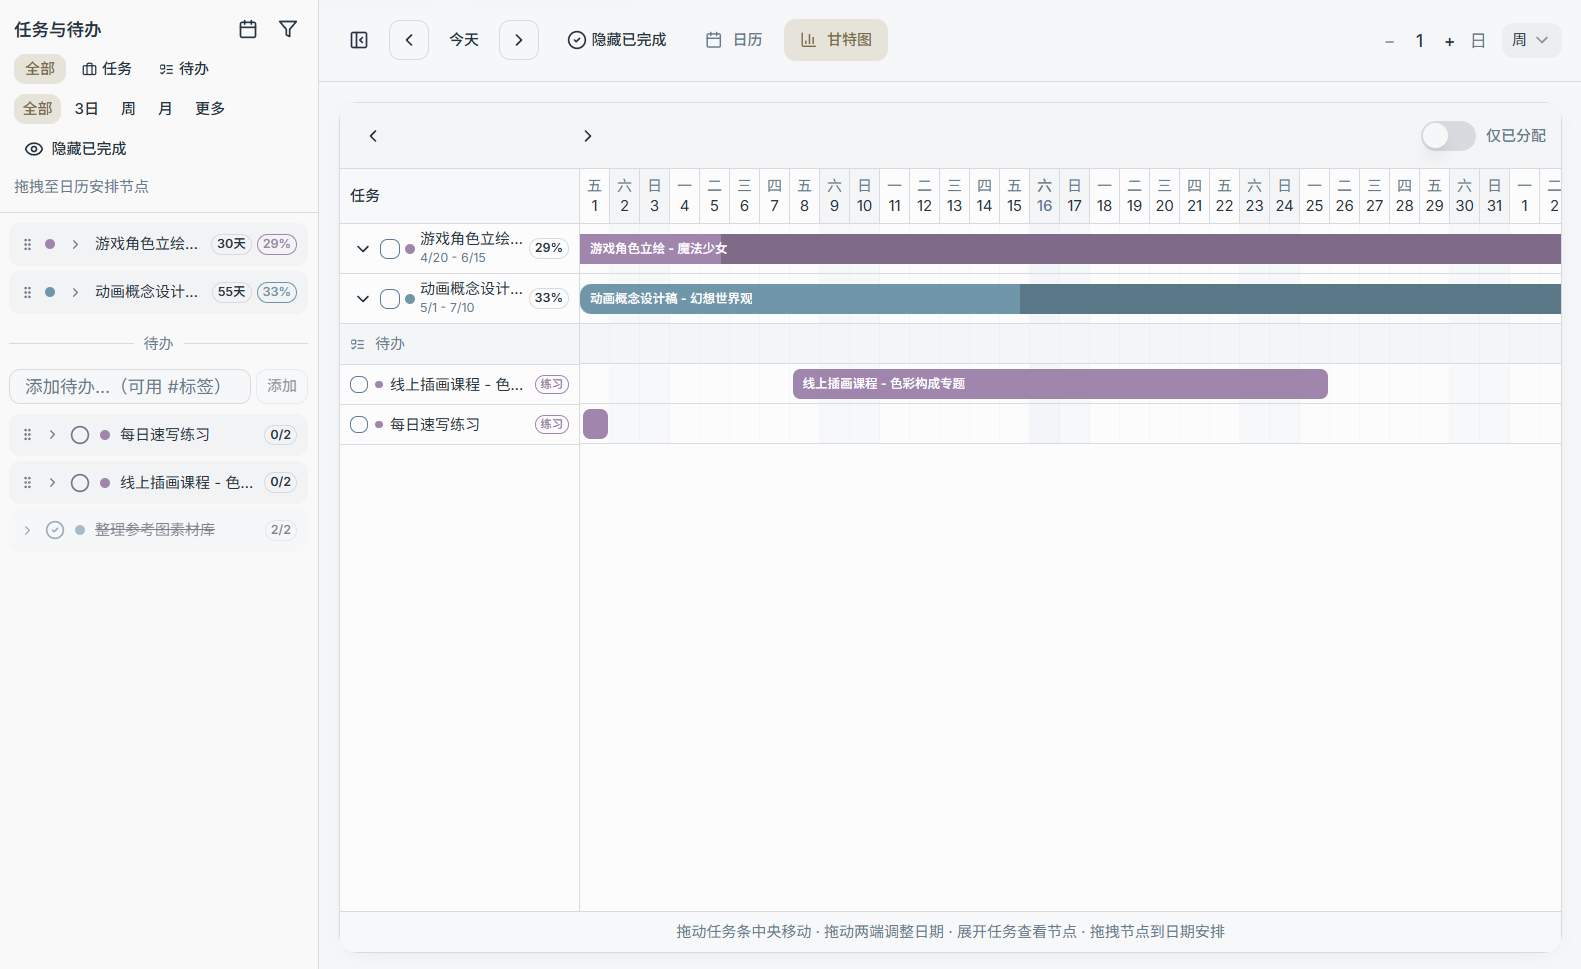
In the view switcher at the top of the calendar, select Gantt Chart.
Common Interactions
Gantt chart capabilities may vary slightly between versions. Common features include:
- Horizontal scrolling to browse through time
- Dragging to adjust a task's time range (if enabled)
- Viewing task details on hover or click